Thinking about digital tools

By limiting gender to “male/female”, we inadvertently exclude non-binary and trans people, replicating the exclusionary logic of mainstream data systems for complex gender identities.

Thinking about gender classification

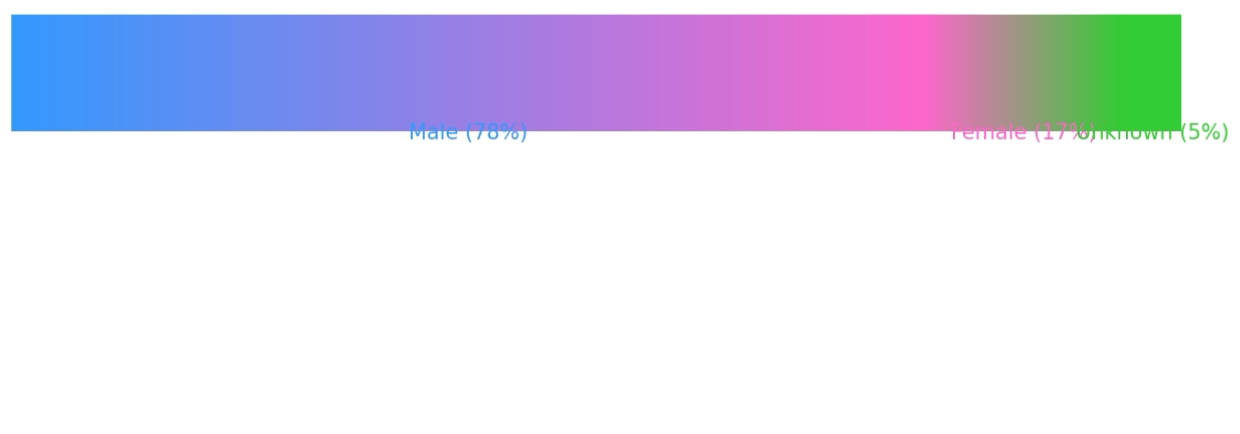
In analysing the column of tenant records for The Housing of the Working Classes Act, 1890. Quarry Hill Unhealthy Area, 1900. A manually extracted, name-based gender inference tool, Genderize.io, was used to estimate the proportion of male versus female occupants in the community. While this method is useful for identifying overall gender trends, it is based on a simplified binary gender framework that defaults to the assumption that everyone can be categorised as either “male” or “female,” ignoring the cultural context of names and their diversity.

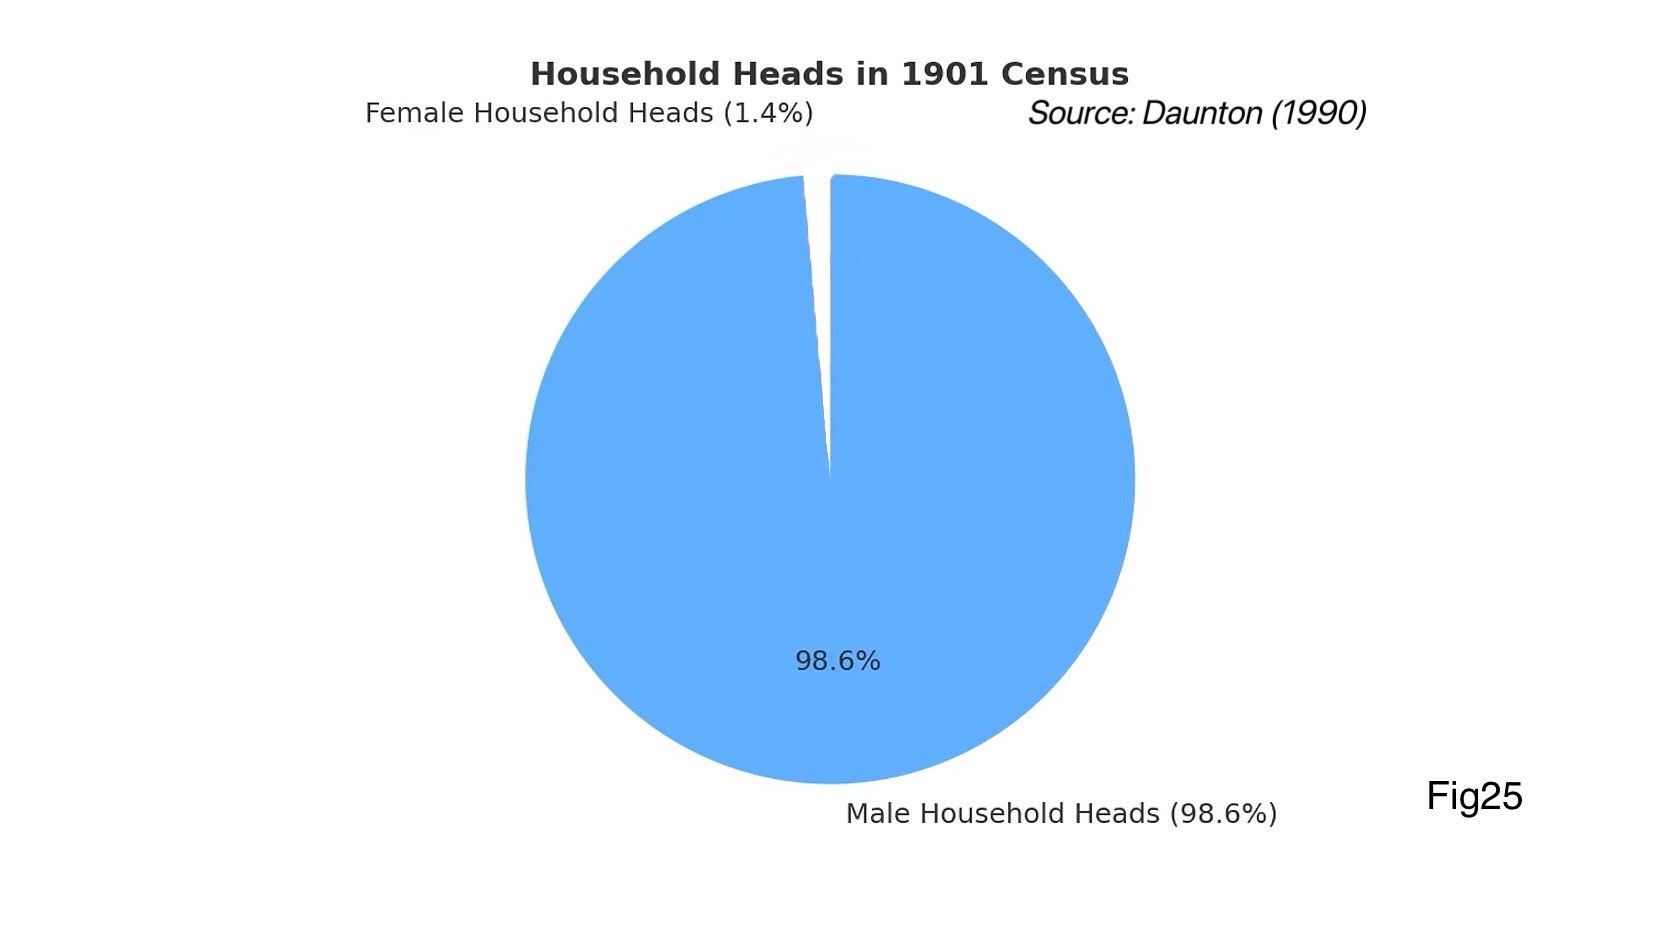
Similarly, our data visualization efforts (e.g., bar charts and timelines), while enhancing the identification of structural patterns, carry the risk of simplification and compression. Clean, neat charts tend to misinterpret “absent” as “unimportant,” inadvertently reinforcing the authority of the archive and overlooking the fact that the gaps may be the most meaningful parts.

Beyond Duality

To address these challenges, we propose future improvements: In terms of gender categorization, we would like to transform gender mapping from a tool to an entry point for critique. Specifically, by introducing alternative categories such as “unknown” and ‘unclassifiable’, and by using spectrum or gradient mapping from “masculine orientation” to “neuter”, we hope that gender mapping will be transformed from an instrument to an entry point for critique. We also use spectrum or gradient diagrams from “masculine tendency” to ‘neutral’ to “feminine tendency” to present the continuity and diversity of gender identities.

Make absence visible

In terms of visualization strategy, we propose to break away from the neat boundaries of traditional charts and use creative techniques such as negative space, glitch aesthetics, or animated erasure to make the “missing” part of the visualization itself. This not only reveals overlooked dimensions in the data, but also gives the “gaps” narrative power. By rethinking the ways in which gender is categorized and visualized, we hope to not only present the data, but also question the structures on which it is based, opening up space for more inclusive and critical digital practices.

From division of labor to consensus

Although we employed a variety of digital tools in the project - including data crawling, interactive design and visualization production - the overall process was somewhat fragmented in terms of technical implementation. As different mediums were developed independently by different members of the team, there were often inconsistencies in visual style and theoretical expression.This fragmentation has somewhat weakened the overall tension and coherence of our feminist critique.

In order to enhance the unity and critical depth of the project, we suggest introducing an earlier and more systematic mechanism of cross-group collaboration in our future practice. For example, by setting up structured cross-review meetings, standardizing design templates, and constructing common theoretical foundations (e.g., collectively reading and discussing literature related to “data feminism”), synergies between media can be enhanced, and our digital outputs can be more coherent and powerful in terms of both visual presentation and ideological expression.